
Onabrand Social Media Brand Comparison Tool
Slide 1 of 3
Social Media Brand Comparison Tool Development
Digitize Info System developed a powerful and data-driven platform for an Africa-based client to compare two brands using real-time social media insights. The primary goal of this project was to build an intelligent system that collects, processes, and analyzes large volumes of social media data to deliver meaningful comparisons between brands based on sentiment, engagement, and reach.
Brand Comparison Analytics Platform with Big Data Processing
The platform allows users to enter two brand names along with specific keywords. Based on these inputs, the system crawls and aggregates data from multiple social media platforms including Facebook, Twitter, YouTube, LinkedIn, and other content sources.
Using advanced data processing techniques and Apache Solr integration, the system efficiently handles large-scale datasets, transforming raw posts, comments, and interactions into structured insights. This enables users to compare brands in a clear and data-backed manner.
Key Features of the Social Media Brand Comparison Tool
- Multi-platform data crawling from social media channels
- Real-time sentiment analysis (positive, negative, neutral)
- Brand comparison based on engagement and reach
- Keyword-based data filtering and analysis
- Interactive dashboards with visual reports
- Freemium model with summary reports and paid detailed insights
Social Media Analytics Dashboard for Brand Comparison
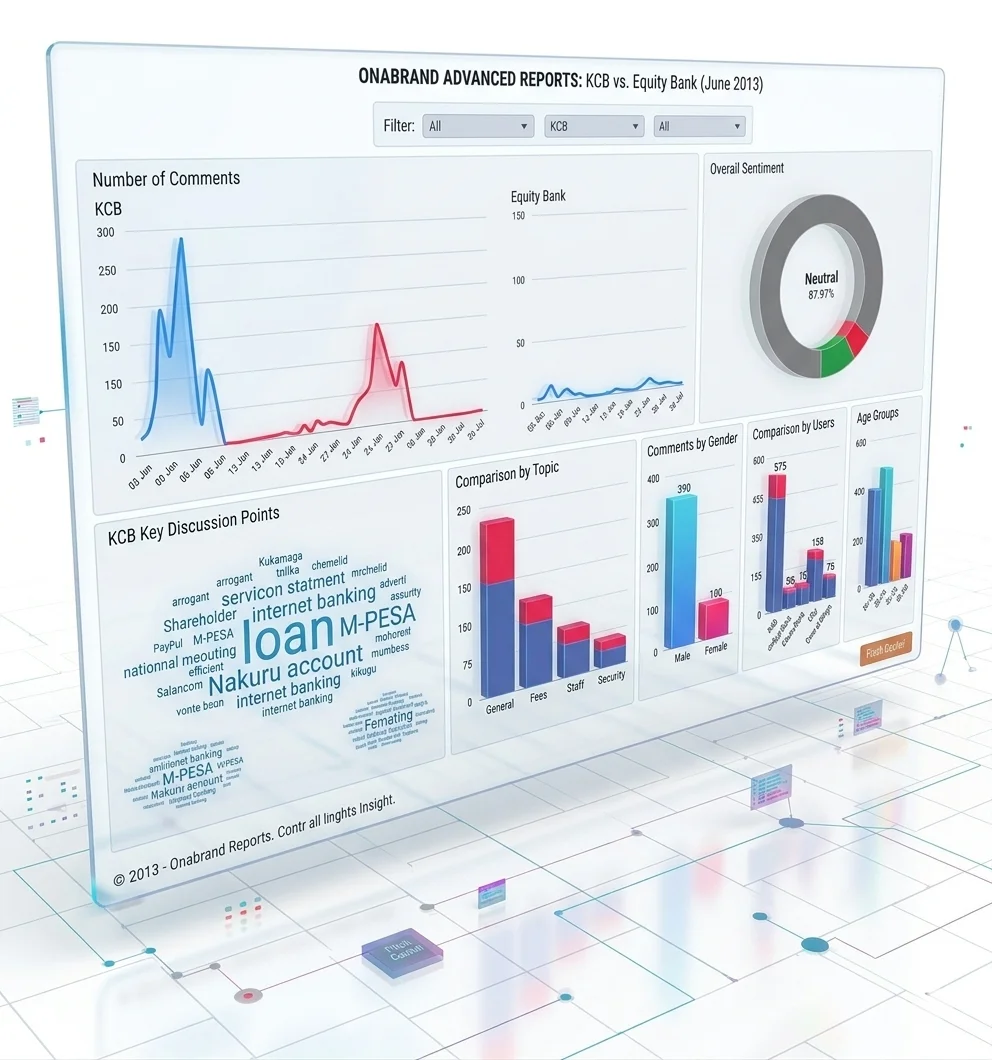
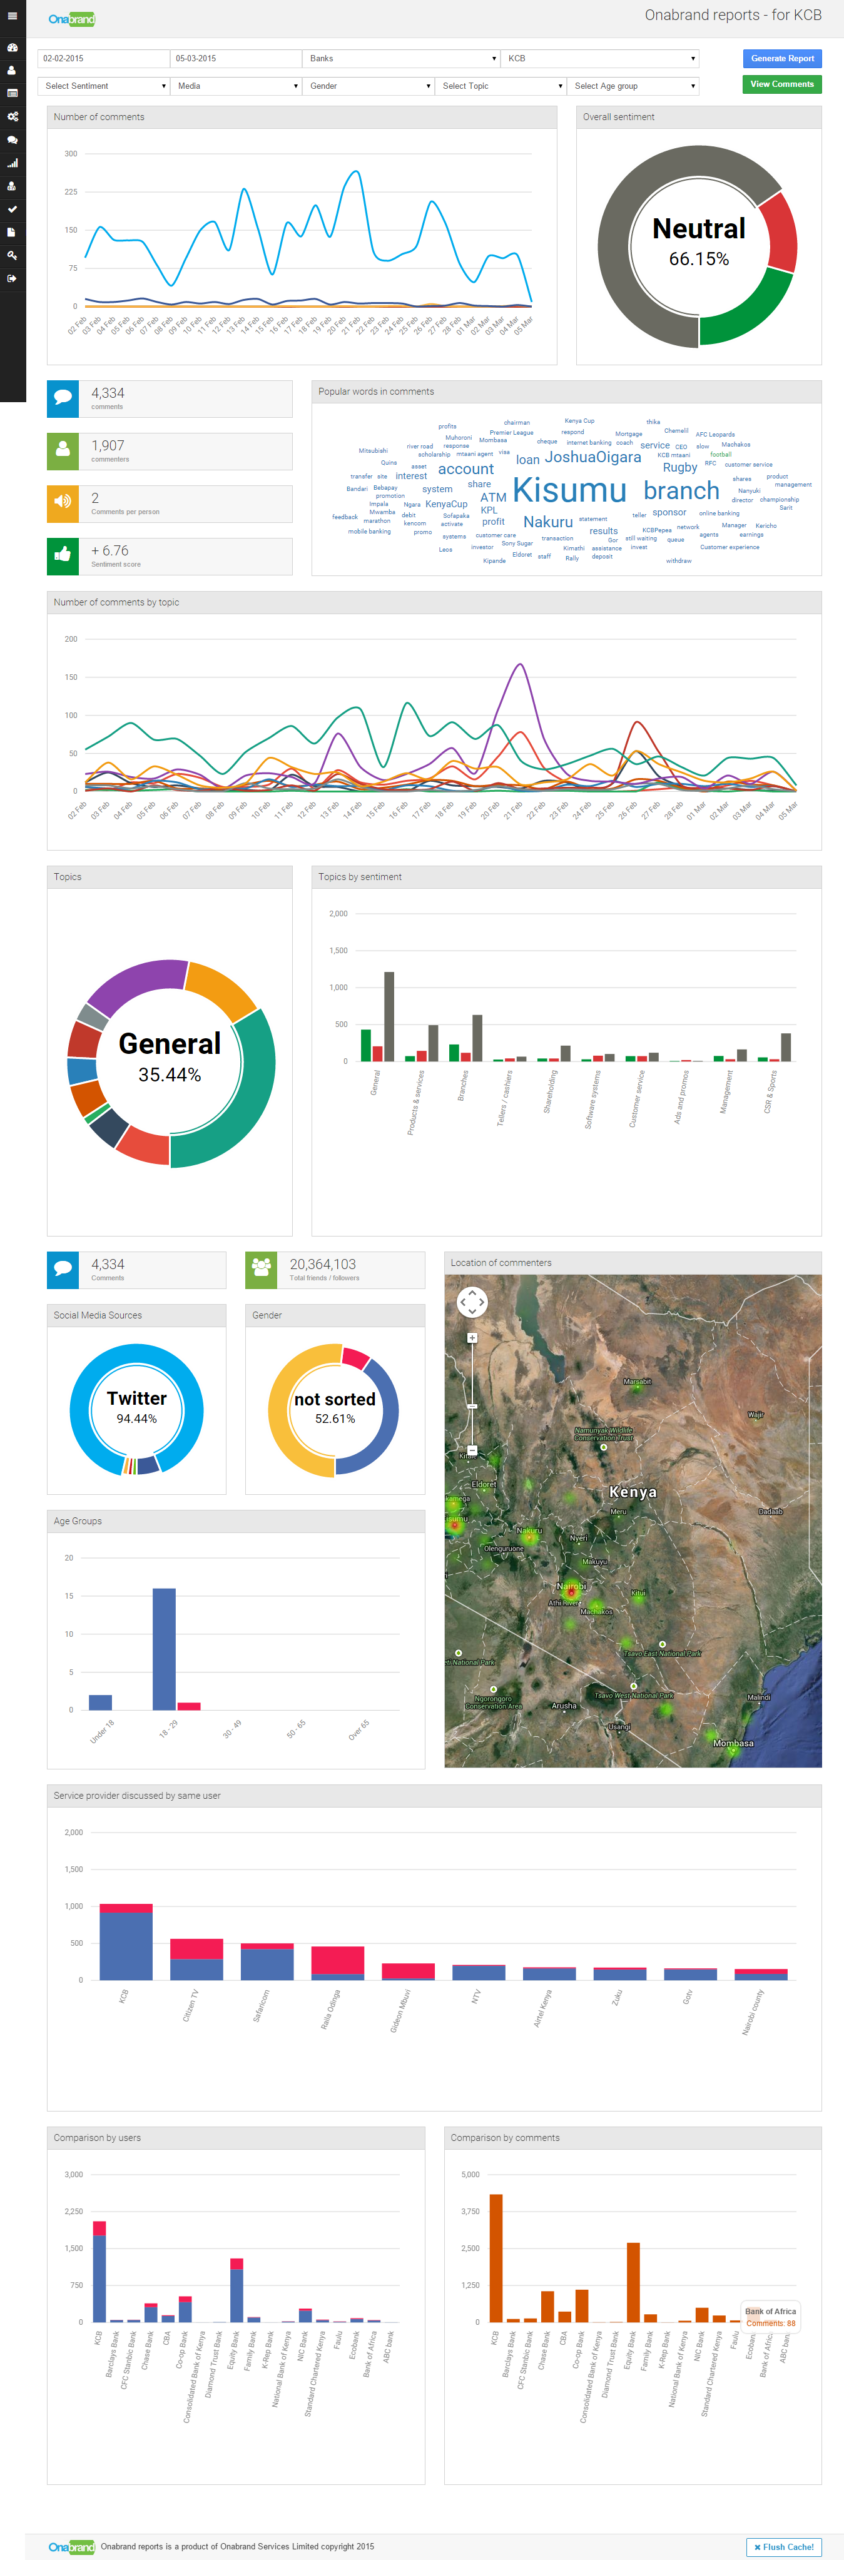
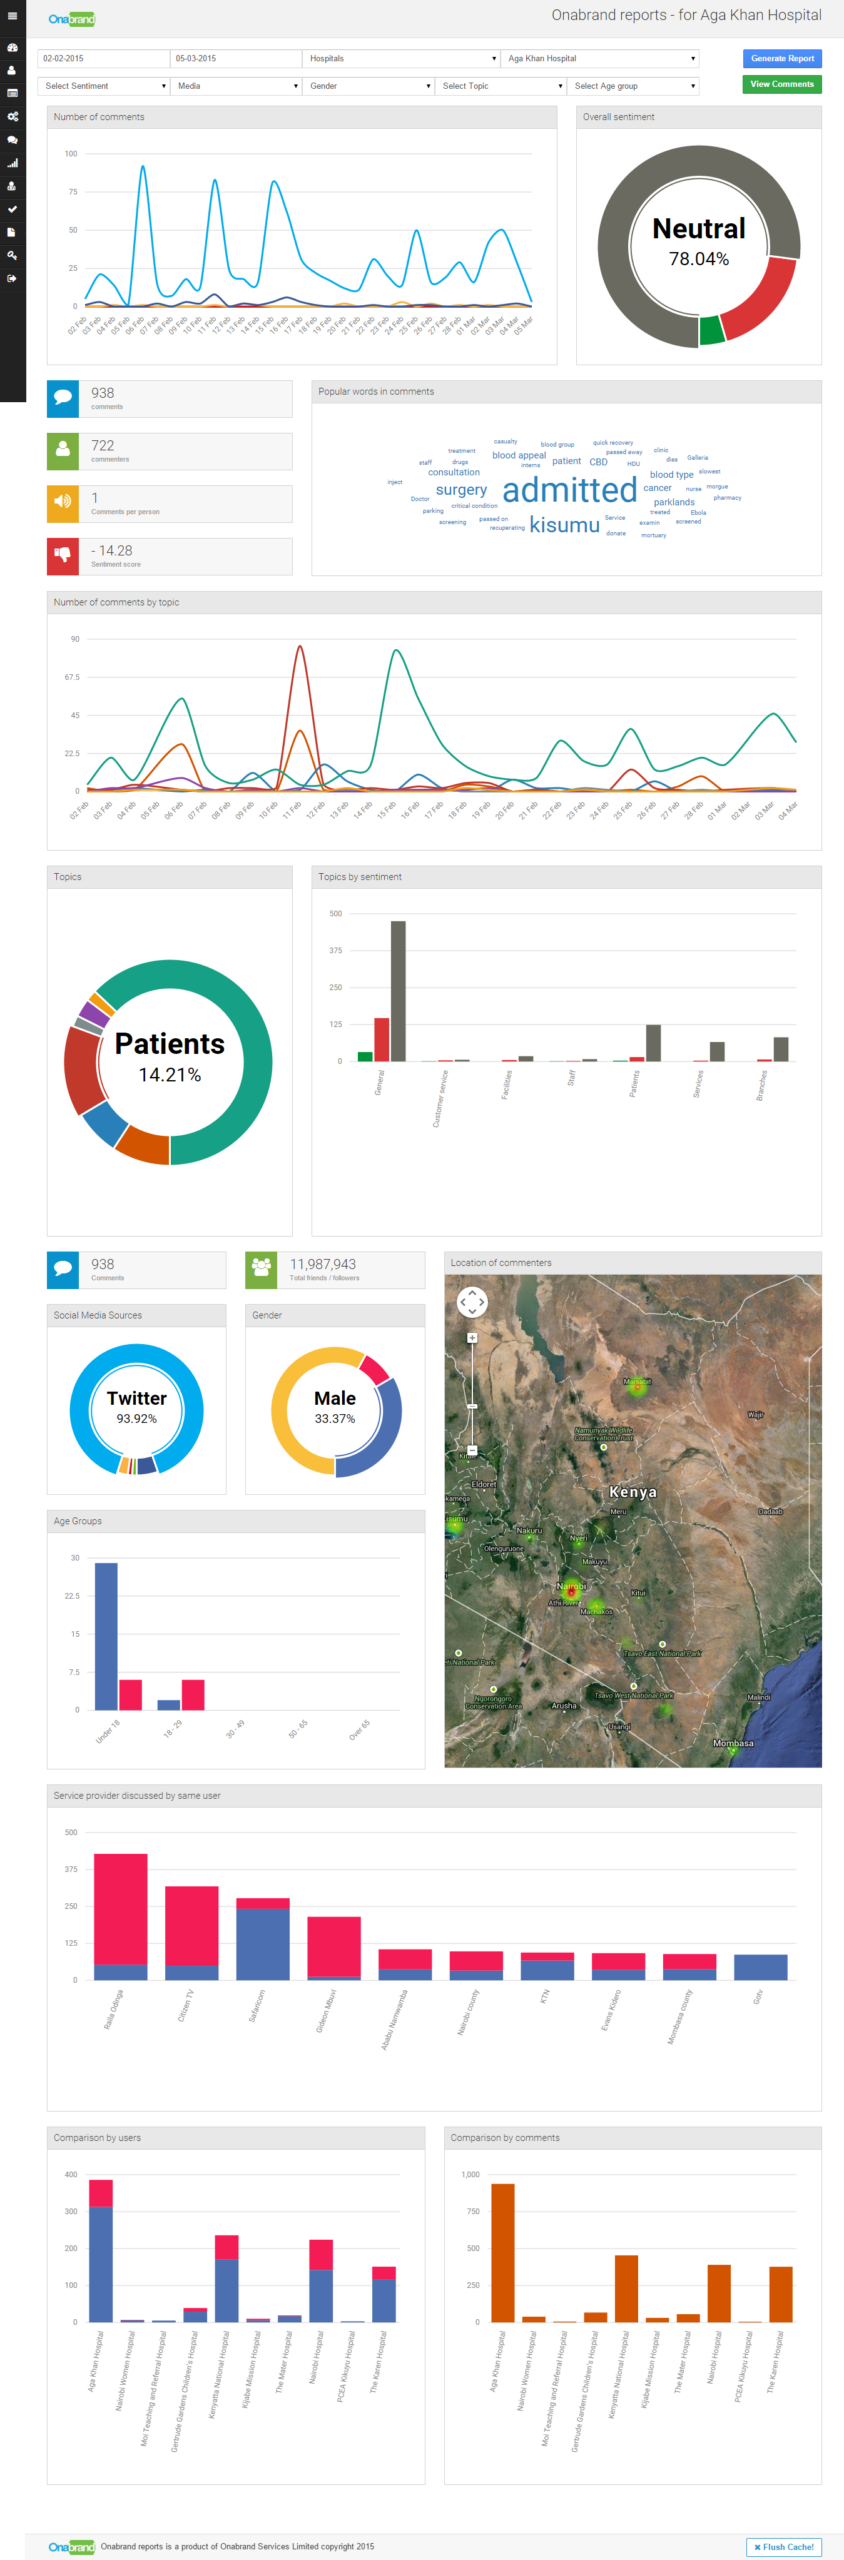
The system provides a comprehensive dashboard that visualizes data through charts, graphs, and maps. Users can easily understand trends such as number of comments, sentiment distribution, and audience engagement over time.
For example, reports include sentiment breakdowns where neutral sentiment can dominate up to 80% of conversations, along with engagement metrics such as comments, commenters, and interaction rates. :contentReference[oaicite:0]{index=0}
Additionally, the platform displays keyword clouds, topic-based discussions, and demographic insights such as gender distribution, age groups, and geographic locations of users interacting with the brands.
Advanced Reporting and Visualization
The system generates detailed reports that include:
- Number of comments and engagement trends over time
- Popular keywords extracted from user conversations
- Topic-wise sentiment analysis
- Comparison of brands based on user discussions
- Geographic heatmaps showing user distribution
- Social media source breakdown (e.g., Twitter dominance)
These insights help businesses understand how their brand is perceived in the market and how it compares with competitors.
Freemium Business Model with Paid Analytics Reports
One of the key aspects of this project was implementing a revenue-driven model. Users can access a summarized version of the report for free, which provides a quick overview of brand performance.
To unlock detailed analytics, users are required to make a payment. This includes access to in-depth reports, advanced comparisons, and extended data insights, making the platform both valuable and commercially viable.
Admin Panel for Complete Platform Management
The platform includes a fully functional admin panel that allows administrators to manage all aspects of the system efficiently. This includes:
- Managing brands and associated keywords
- Controlling reports and analytics data
- User management and access control
- Payment tracking and subscription management
- Monitoring system performance and data flow
This centralized control ensures smooth operation and scalability of the platform.
Technology Stack for Scalable Analytics Platform
To handle large volumes of social data and deliver real-time insights, we implemented a robust and scalable technology stack:
- Backend: Yii Framework (PHP)
- Search & Data Processing: Apache Solr
- Database: MySQL
- Frontend: HTML, CSS, JavaScript
- Integration: APIs for multiple social media platforms
This combination allowed the system to efficiently process big data, perform fast searches, and deliver accurate analytics.
How Digitize Info System Delivered Results
Digitize Info System successfully delivered a high-performance analytics platform tailored to the client’s business model. The solution provided:
- Accurate brand comparison using real-time data
- Improved decision-making through actionable insights
- Scalable architecture for handling big data
- Revenue generation through paid reports
- User-friendly dashboards with visual analytics
The platform empowered businesses to understand their market position and make data-driven marketing and branding decisions.
Conclusion: Powerful Social Media Brand Comparison Tool
This project demonstrates how advanced data analytics and social media integration can transform raw data into meaningful business intelligence. By combining big data processing with intuitive dashboards, we created a platform that delivers real value to users.
If you are looking to build a scalable social media analytics dashboard or a brand comparison analytics platform, Digitize Info System can help you turn your vision into a powerful digital product.
Frequently Asked Questions
A brand comparison tool aggregates data from multiple social media channels so businesses can see how their brand performs against competitors. This kind of insight highlights differences in sentiment, engagement, and reach for each brand.
With clear visualization and side-by-side metrics, companies can identify strengths, gaps, and opportunities for messaging or audience growth. That makes it easier to refine marketing strategies based on real-time social signals.
Sentiment analysis helps businesses understand how audiences feel about each brand, whether reactions are positive, negative, or neutral. In a brand comparison dashboard, this adds emotional context to raw engagement numbers.
That insight is especially valuable for marketing teams because it can reveal emerging reputation issues and highlight which campaigns are resonating. It turns social media data into actionable brand intelligence.
Social media analytics platforms must handle large volumes of posts, comments, and interactions from many sources. Scalable data processing ensures the system can keep up as the number of tracked brands and queries grows.
When the backend is built for scale, users get faster comparisons and more reliable reporting. That makes the platform suitable for organizations that need to monitor multiple brands simultaneously.
A custom tool can be configured to compare the exact metrics that matter most to a company, such as engagement, sentiment, share of voice, and audience growth. That makes the output more relevant than generic dashboards.
By surfacing meaningful comparisons instead of raw data, the platform helps stakeholders focus on strategic moves and marketing investments. This leads to more informed decisions and better campaign planning.
Interested in a similar project?
Let's explore how we can bring your vision to life. Contact us for a free consultation.
Start Your Project